The Customer Technology Department (CTD) at the Massachusetts Bay Transit Authority (MBTA) faced challenges in effectively recruiting participants for UX research and design, compounded by each team's distinct demographic benchmarks. I developed a streamlined demographic benchmark and research guide to assist the team in identifying and recruiting diverse research participants. Collaborated with stakeholders from MBTA and the Boston community to compile a list of organizations and departments that were open to supporting recruitment efforts.
Project Overview
Duration: 12 weeks in Summer 2022
Collaborators: Customer Technology Department (CTD), Transit Riders
Role: Researcher, Designer
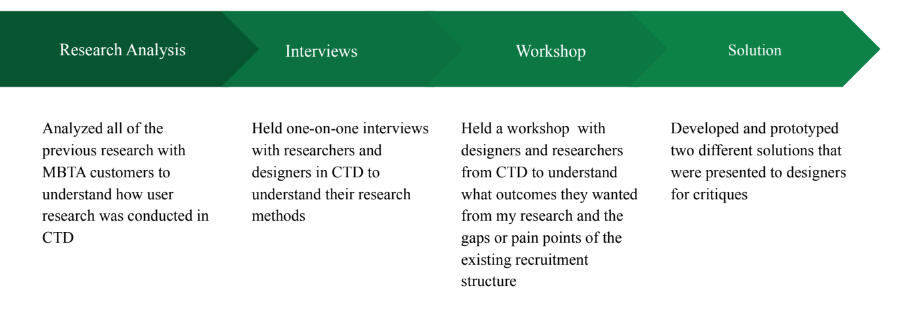
Research Plan
Research Question
How can CTD ensure that participants recruited for research reflect the diverse riders that utilize MBTA’s services?
Research Methodology and Outcomes
Participants Interviewed: 6
Research Type: Virtual interviews
Interview Time: 60 minutes each
Research Session Activity: Conversation
Position Background: CTD team member
Workshop Activities
Journey Mapping provided clarity on how the CTD team conducts research and the various different methodologies and approaches they were using. Furthermore, through this clarity we were able to identify challenges regarding how different groups were conducting some of the same types of research.
Findings
There was no clarity regarding where all of the riders recruited for participant research were signing up at.
After interviews with CTD team members the following findings and pain points were discovered, leading to a different research approach.
Identified Research Problems
Lack of a clear understanding of how past riders have been recruited for research in different teams (ex: reduced fares, Screens, alerts, mbta.com, shuttles, crowding)
Clarity on the what has been the most challenging in the research with riders.
Need for resources that will make the biggest positive impact in the work of the research
Uncover pain points that CTD team is facing with the current Research Participant List


As a final point within the research, participants were shown Data Visualizations based on a one year worth of research projects for their respective teams. This data also noted gaps within their research process where certain teams might have been using specific methods which selecting participants, while others selected none.
Through journey mapping, participants were able to identify Pain & Positive Points that they noticed through their research process. Furthermore I was also able to see where people had similar pain points as we spent time identifying them as a group and clustering sticky notes with overlapping themes.

There were anomalies within the research data because riders were interpreting research questions differently.
Solutions
The first deliverable were a collection of resources across the MBTA departments that would allow the CTD team to recruit participants reflective of the greater Boston Area. Resources included a list of community organizations willing to share with their members and a recruitment form specifically for the MBTA’s Department of System-Wide Accessibility (SWA).

The second deliverable was Rider Recruitment Guidelines which accessed the ongoing excel list of riders who signed up for research and allowed for a more organized way of ensuring that participants recruited met the Demographic Benchmarks set by the MBTA.

